目次
Chartコントロール(Windowsアプリケーション)
VS2013標準のChartコントロール(Windowsアプリケーション)を使用してグラフを描画したいと思います。標準機能ではありますがかなりの高機能です。 機会がありましたらグラフの種類は全パターンを網羅したいと思います。今回はその中から抜粋したサンプルソースを掲載しております。必要があれば その都度追記したいと思います。
ChartTypeで指定できるSeriesChartType列挙体のメンバー名
ChartTypeで指定できるSeriesChartType列挙体のメンバー名は以下のとおりです。
- Point-ポイントグラフ
- FastPoint-FastPointグラフ
- Bubble-バブルチャート
- Line-折れ線グラフ
- Spline-スプライングラフ
- StepLine-StepLineグラフ
- FastLine-FastLineグラフ
- Bar-横棒グラフ
- StackedBar-積み上げ横棒グラフ
- StackedBar100-100%積み上げ横棒グラフ
- Column-縦棒グラフ
- StackedColumn-積み上げ縦棒グラフ
- StackedColumn100-100%積み上げ縦棒グラフ
- Area-面グラフ
- SplineArea-スプライン面グラフ
- StackedArea-積み上げ面グラフ
- StackedArea100-100%積み上げ面グラフ
- Pie-円グラフ
- Doughnut-ドーナツグラフ
- Stock-株価チャート
- Candlestick-ローソク足チャート
- Range-範囲グラフ
- SplineRange-スプライン範囲グラフ
- RangeBar-RangeBarグラフ
- RangeColumn-範囲縦棒グラフ
- Radar-レーダーチャート
- Polar-極座標グラフ
- ErrorBar-誤差範囲グラフ
- BoxPlot-ボックスプロットグラフ
- Renko-練行足チャート
- ThreeLineBreak-ThreeLineBreakグラフ
- Kagi-かぎ足チャート
- PointAndFigure-PointAndFigureグラフ
- Funnel-じょうごグラフ
- Pyramid-ピラミッドグラフ
スポンサーリンク
初期グラフ
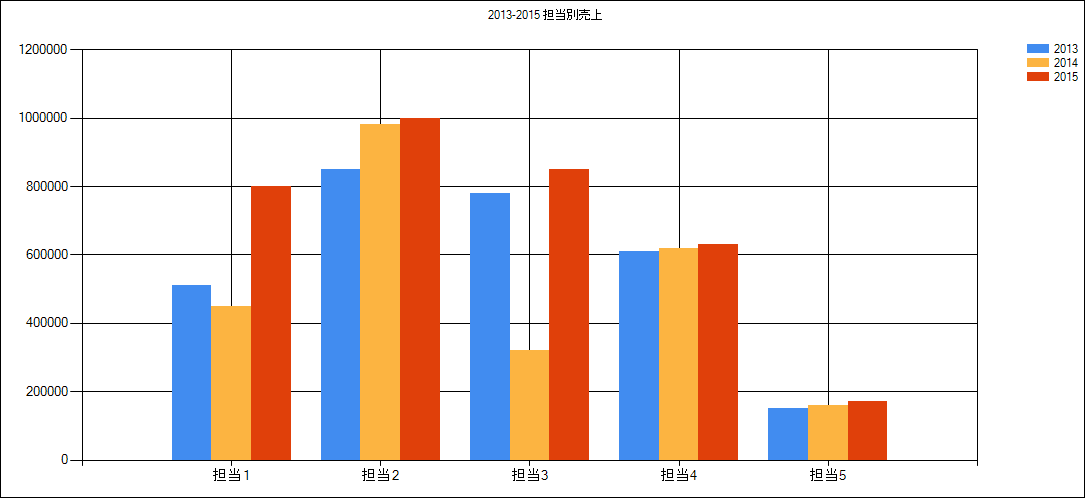
処理グラフはシンプルな以下のとおり2D縦棒グラフです。
3D縦棒グラフ
	using System.Windows.Forms.DataVisualization.Charting;

	//3D表示=============================================
	Chart.ChartAreas[0].Area3DStyle.Enable3D = true;
	Chart.ChartAreas[0].Area3DStyle.Inclination = 10;
	Chart.ChartAreas[0].Area3DStyle.Rotation = 10;
	Chart.ChartAreas[0].Area3DStyle.PointGapDepth = 100;
	Chart.ChartAreas[0].Area3DStyle.PointDepth = 100;
	//===================================================
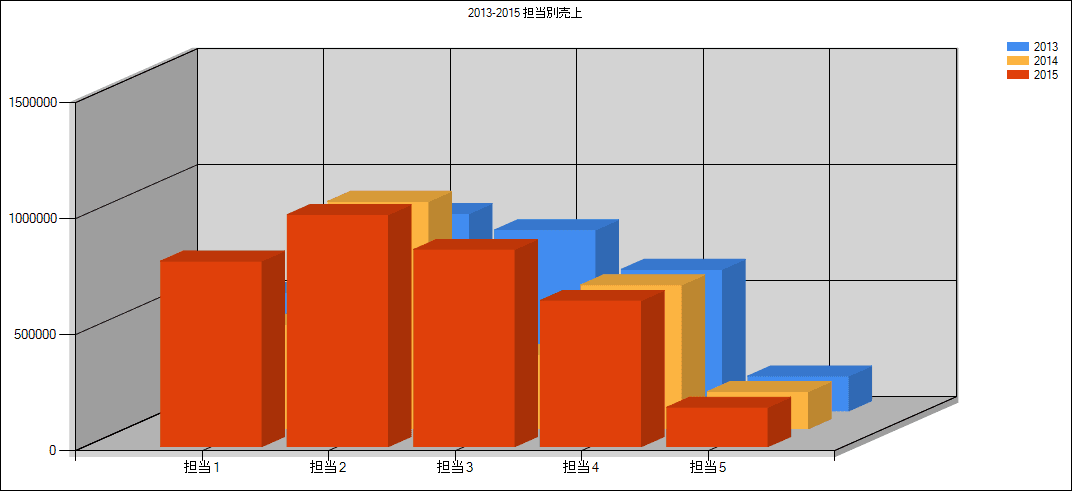
グラフの部分が重複しておりますが、前面のグラフを透過することにより、後面のグラフを見せることも可能です。
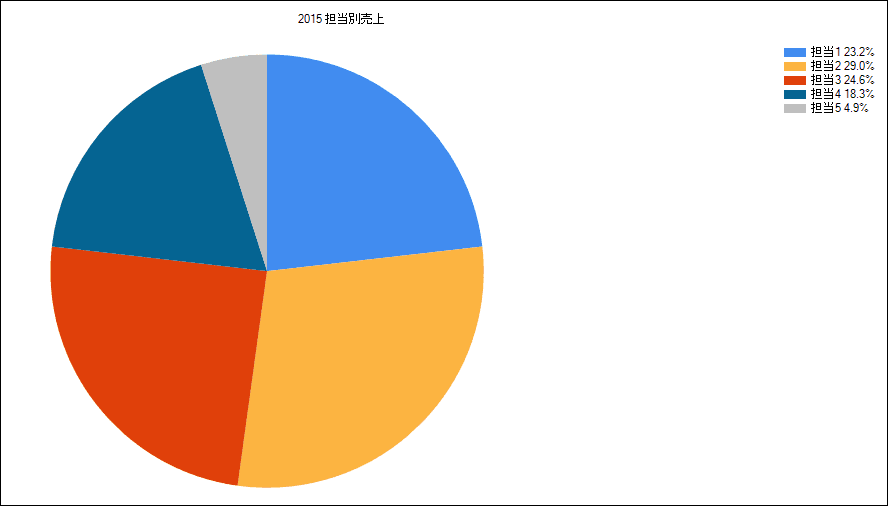
2D円グラフ
	using System.Windows.Forms.DataVisualization.Charting;

	//円グラフ=================================================
	for (int i = 0; i < Chart.Series.Count; i++)
	{
		Chart.Series[i].ChartType = SeriesChartType.Pie;
		Chart.Series[i]["PieStartAngle"] = "270";//開始位置
	}
	//=========================================================
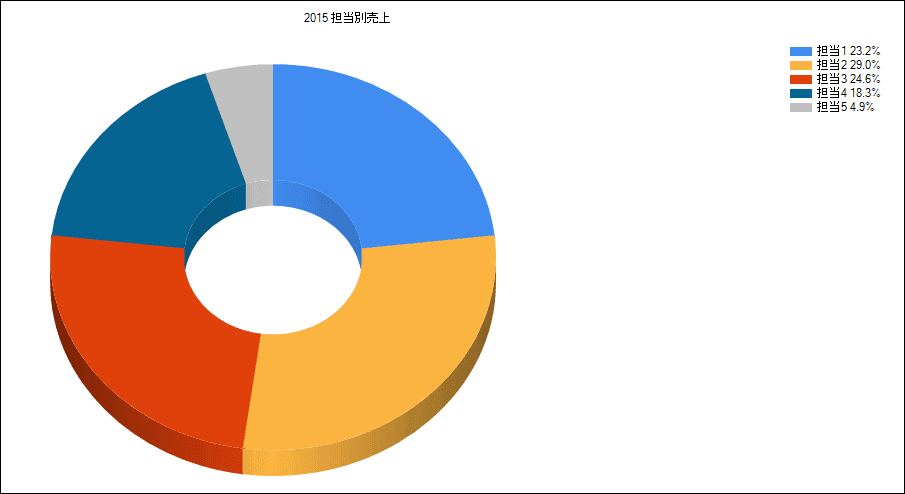
3Dドーナッツ型グラフ
	using System.Windows.Forms.DataVisualization.Charting;

	//ドーナッツ型グラフ=========================================
	Chart.ChartAreas[0].Area3DStyle.Enable3D = true;
	for (int i = 0; i < Chart.Series.Count; i++)
	{
		Chart.Series[i].ChartType = SeriesChartType.Doughnut;
		Chart.Series[i]["PieStartAngle"] = "270";//開始位置
	}
	//===========================================================
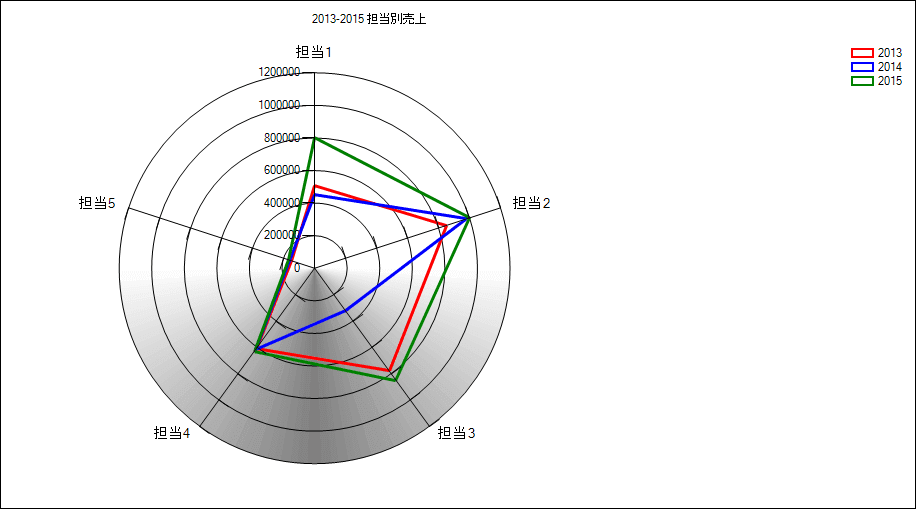
3Dレーダーチャート
	using System.Windows.Forms.DataVisualization.Charting;

	//レーダーチャート型グラフ================================
	Color[] col = new Color[3];
	col[0] = Color.Red;
	col[1] = Color.Blue;
	col[2] = Color.Green;
	Chart.ChartAreas[0].Area3DStyle.Enable3D = true;
	for (int i = 0; i < Chart.Series.Count; i++)
	{
		Chart.Series[i].ChartType = SeriesChartType.Radar;
		Chart.Series[i].Color = Color.Transparent;
		Chart.Series[i].BorderColor = col[i];
		Chart.Series[i].BorderWidth = 3;
	}
	//========================================================
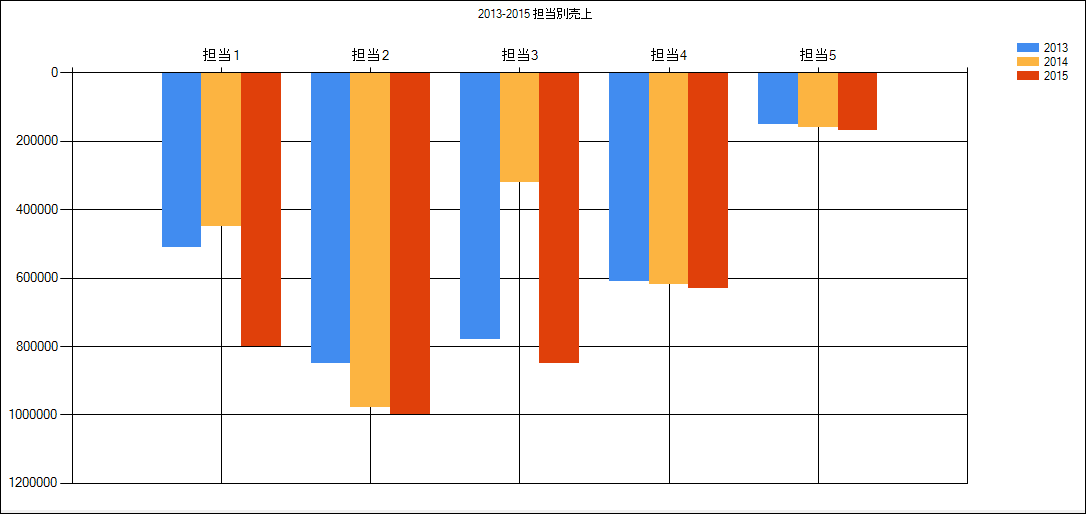
2D吊り下げ
	using System.Windows.Forms.DataVisualization.Charting;

	//吊り下げ====================================
	Chart.ChartAreas[0].AxisY.IsReversed = true;
	//============================================
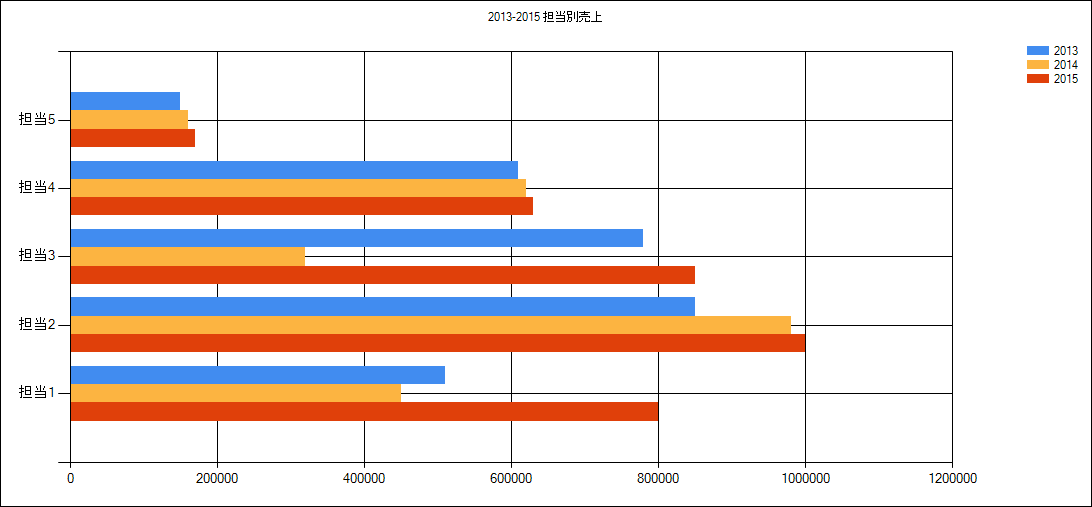
2D横棒グラフ
	using System.Windows.Forms.DataVisualization.Charting;

	//横棒==================================================
	for (int i = 0; i < Chart.Series.Count; i++)
	{
		Chart.Series[i].ChartType = SeriesChartType.Bar;
	}
	//======================================================
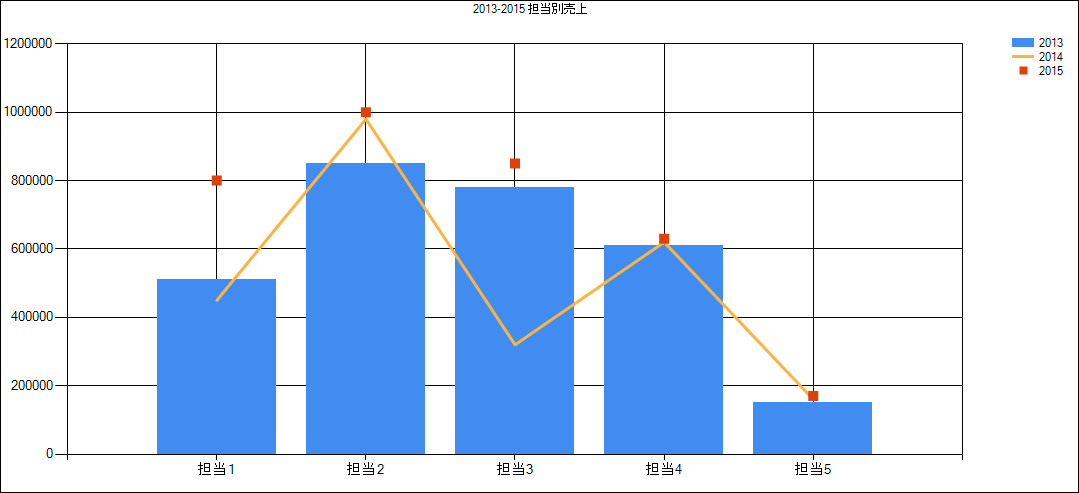
グラフ種類
	using System.Windows.Forms.DataVisualization.Charting;

	//グラフ種類=======================================
	Chart.Series[0].ChartType = SeriesChartType.Column;
	Chart.Series[1].ChartType = SeriesChartType.Line;
	Chart.Series[1].BorderWidth = 3;
	Chart.Series[2].ChartType = SeriesChartType.Point;
	Chart.Series[2].MarkerSize = 10;
	//=================================================
グラデーション
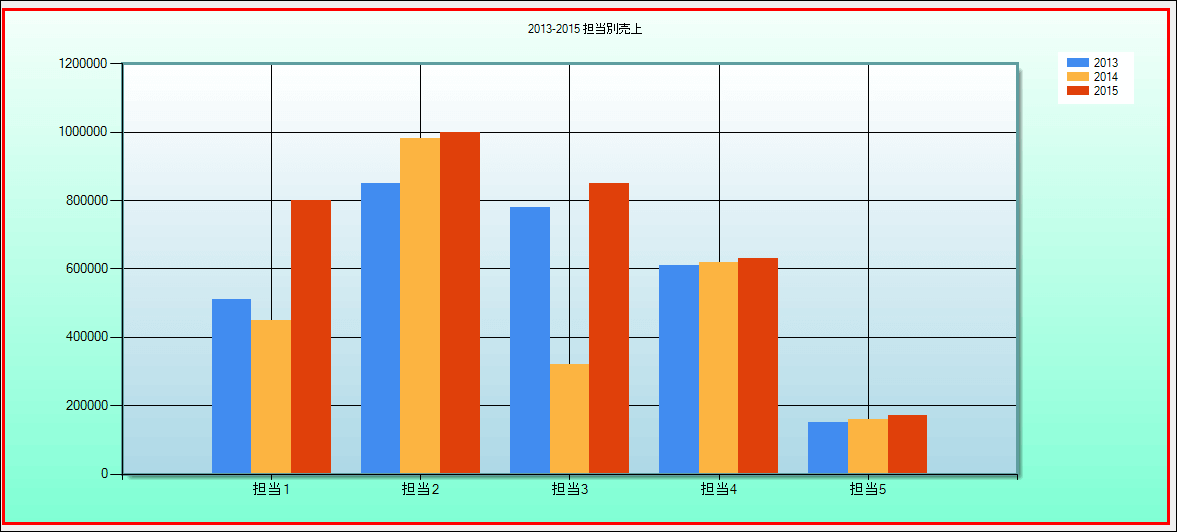
	using System.Windows.Forms.DataVisualization.Charting;

	//背景============================================
	//上から下
	Chart.BackGradientStyle = GradientStyle.TopBottom;
	Chart.BackColor = Color.MintCream;
	Chart.BackSecondaryColor = Color.Aquamarine;
	//================================================

	//プロットエリア================================================
	//上から下
	Chart.ChartAreas[0].BackGradientStyle = GradientStyle.TopBottom;
	Chart.ChartAreas[0].BackColor = Color.White;
	Chart.ChartAreas[0].BackSecondaryColor = Color.LightBlue;
	//==============================================================
ポイントラベル
	using System.Windows.Forms.DataVisualization.Charting;

	//ポイントラベル====================================
	for (int i = 0; i < Chart.Series.Count; i++)
	{
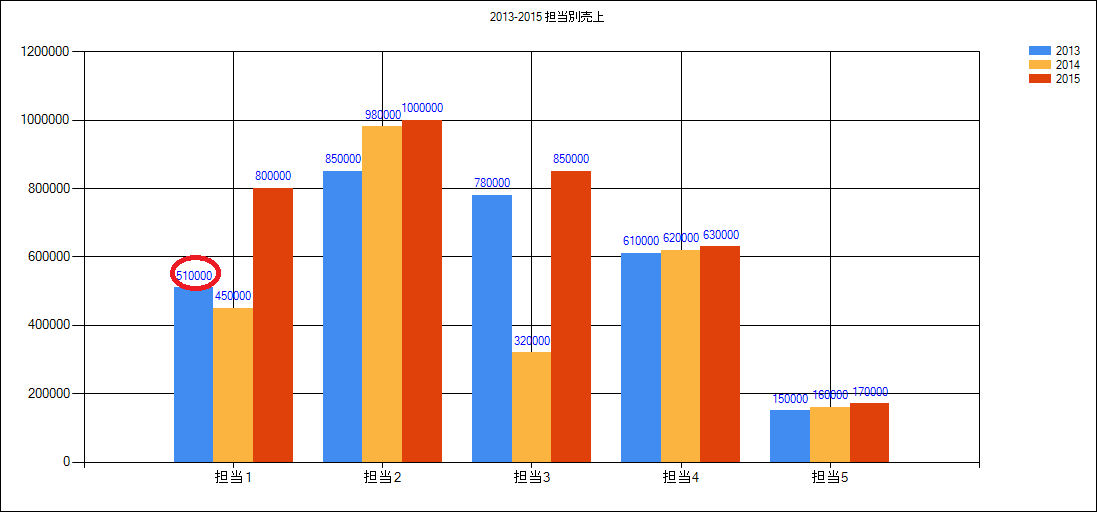
		Chart.Series[i].Label = "#VALY";
		Chart.Series[i].LabelForeColor = Color.Blue;
	}
	//==================================================
X軸
	using System.Windows.Forms.DataVisualization.Charting;

	//凡例の表示,非表示===========================================
	Chart.Series[0].IsVisibleInLegend = false;
	Chart.Series[1].IsVisibleInLegend = false;
	Chart.Series[2].IsVisibleInLegend = false;
	//============================================================

	//X軸関連
	//グラフの最初のデータまでの左の余白==========================
	Chart.ChartAreas[0].AxisX.IsMarginVisible = false;
	//============================================================

	//タイトル====================================================
	Chart.ChartAreas[0].AxisX.Title = "担当営業";
	//============================================================

	//タイトルのフォントを設定====================================
	Chart.ChartAreas[0].AxisX.TitleFont = new Font("MS 明朝", 10, FontStyle.Regular | FontStyle.Underline);
	Chart.ChartAreas[0].AxisX.TitleForeColor = Color.Red;
	//============================================================

	//ラベルの区切り線の表示開始位置設定==========================
	Chart.ChartAreas[0].AxisX.MajorGrid.IntervalOffset = 0.5;
	//============================================================

	//X軸線=======================================================
	Chart.ChartAreas[0].AxisX.LineColor = Color.Green;
	Chart.ChartAreas[0].AxisX.LineWidth = 3;
	//============================================================

	//棒の幅設定==================================================
	//既定値0.8
	Chart.Series[0]["PointWidth"] = "1.0";
	Chart.Series[1]["PointWidth"] = "0.7";
	Chart.Series[2]["PointWidth"] = "0.5";
	//============================================================
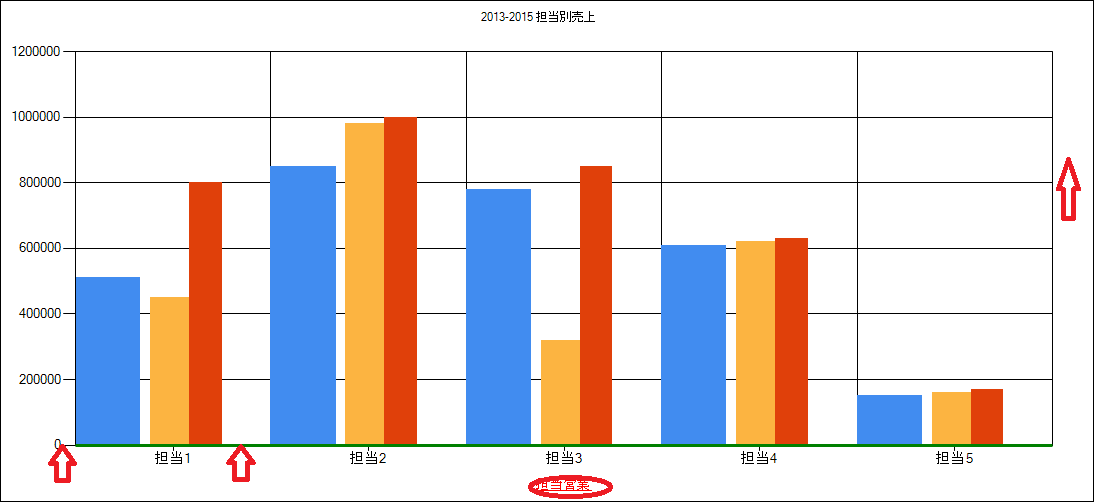
凡例非表示も一緒に処理しています。
左余白をとらない,X軸タイトル,Font設定(赤色,下線付き),区切り線の開始位置,X軸線,棒の幅設定
Y軸
	using System.Windows.Forms.DataVisualization.Charting;

	//Y軸関連
	//タイトル=======================================================================
	Chart.ChartAreas[0].AxisY.Title = "売上";
	Chart.ChartAreas[0].AxisY.TextOrientation = TextOrientation.Stacked;//縦方向表示
	//===============================================================================

	//タイトルフォント===============================================================
	Chart.ChartAreas[0].AxisY.TitleFont = new Font("MS 明朝", 10, FontStyle.Regular);
	Chart.ChartAreas[0].AxisY.TitleForeColor = Color.Blue;
	//===============================================================================

	//桁区切り表示===================================================================
	Chart.ChartAreas[0].AxisY.LabelStyle.Format = "#,##0";
	//===============================================================================

	//目盛線設定=====================================================================
	Chart.ChartAreas[0].AxisY.Maximum = 1400000;//最大値
	Chart.ChartAreas[0].AxisY.Minimum = 0;//最小値
	Chart.ChartAreas[0].AxisY.Interval = 200000;//間隔
	//===============================================================================

	//補助線設定=====================================================================
	Chart.ChartAreas[0].AxisY.MinorGrid.Enabled = true;
	Chart.ChartAreas[0].AxisY.MinorGrid.Interval = 100000;
	Chart.ChartAreas[0].AxisY.MinorGrid.LineDashStyle = ChartDashStyle.Dash;
	Chart.ChartAreas[0].AxisY.MinorGrid.LineColor = Color.Red;
	//===============================================================================

	//境界縦線=======================================================================
	Chart.ChartAreas[0].AxisY.LineWidth = 3;
	Chart.ChartAreas[0].AxisY.LineColor = Color.Red;
	Chart.ChartAreas[0].AxisY.LineDashStyle = ChartDashStyle.Solid;
	//===============================================================================

	//X軸反転設定====================================================================
	Chart.ChartAreas[0].AxisX.IsReversed = true;
	//===============================================================================
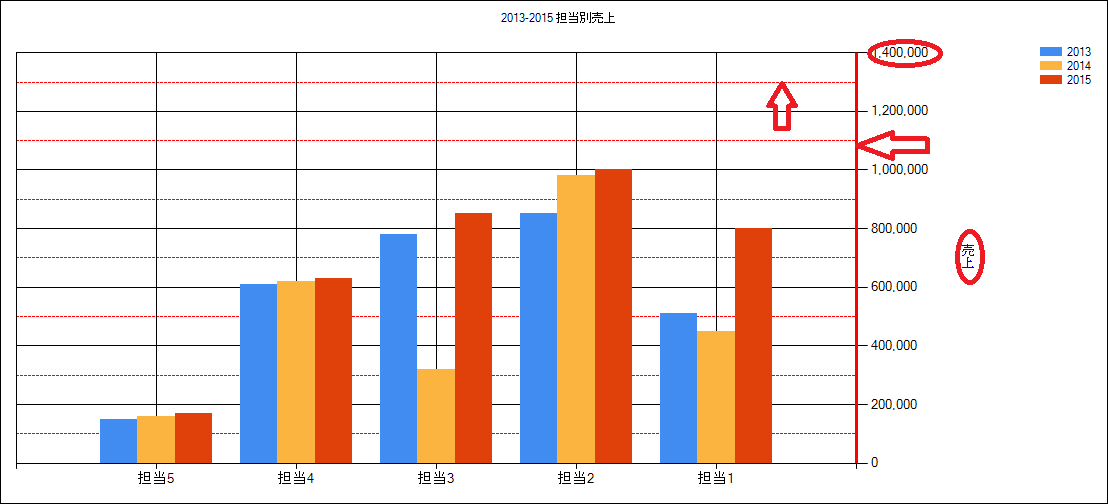
Y軸タイトル,縦表示,Font設定(青色),桁区切り表示
目盛線設定,補助線設定,境界縦線,X軸反転設定
境界線,外形
	using System.Windows.Forms.DataVisualization.Charting;

	//境界線===================================================
	Chart.BorderColor = Color.Red;
	Chart.BorderDashStyle = ChartDashStyle.Solid;
	Chart.BorderWidth = 3;
	//=========================================================

	//プロットエリアの境界線描画===============================
	Chart.ChartAreas[0].BorderDashStyle = ChartDashStyle.Solid;
	Chart.ChartAreas[0].BorderWidth = 3;
	Chart.ChartAreas[0].BorderColor = Color.CadetBlue;
	Chart.ChartAreas[0].ShadowOffset = 5;
	//=========================================================
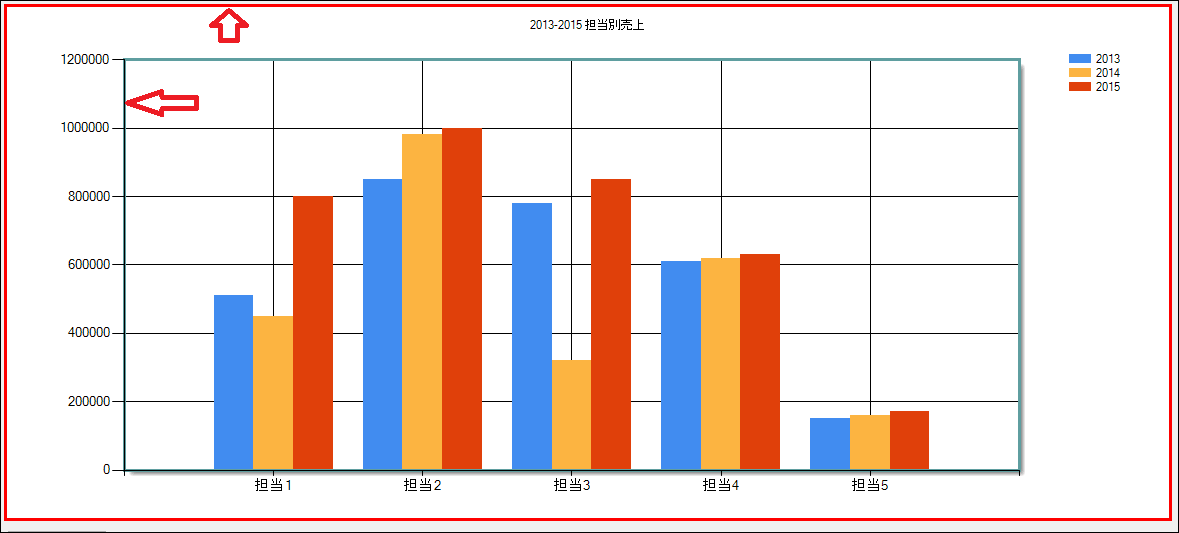
境界線 BorderColor,BorderDashStyle,BorderWidthを設定しております。
外形は再描画しております。
タイトル,パレット
	using System.Windows.Forms.DataVisualization.Charting;

	//タイトル関連設定=====================================================
	Chart.Titles[0].Alignment = ContentAlignment.TopCenter;//上部中央に表示
	Chart.Titles[0].ForeColor = Color.Blue;
	Chart.Titles[0].Font = new Font("MS 明朝", 12, FontStyle.Bold | FontStyle.Underline);
	//=====================================================================

	//パレット=============================================================
	Chart.Palette = ChartColorPalette.Berry;
	//=====================================================================

	//凡例設定=============================================================
	Chart.Series[0].LegendText = "2013年売上";
	Chart.Series[1].LegendText = "2014年売上";
	Chart.Series[2].LegendText = "2015年売上";
	Chart.Legends[0].BorderColor = Color.Red;
	Chart.Legends[0].BackColor = Color.LightCyan;
	Chart.Legends[0].ShadowOffset = 4;
	//=====================================================================
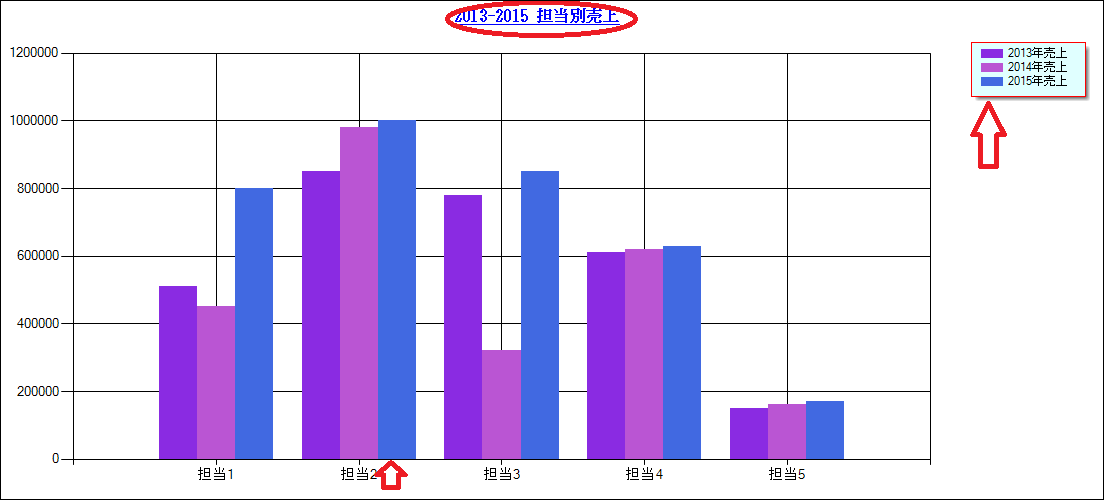
タイトル位置を上部中央,テキスト=青色,MS明朝,12,太字(下線)で表示
パレットは、ChartColorPalette.Berryですが、他にもありますのでお試しください。
境界線(BorderSkin)
	using System.Windows.Forms.DataVisualization.Charting;

	//境界線============================================
	Chart.BorderColor = Color.Blue;
	Chart.BorderDashStyle = ChartDashStyle.Solid;
	Chart.BorderWidth = 8;
	Chart.BorderSkin.SkinStyle = BorderSkinStyle.Raised;
	//==================================================
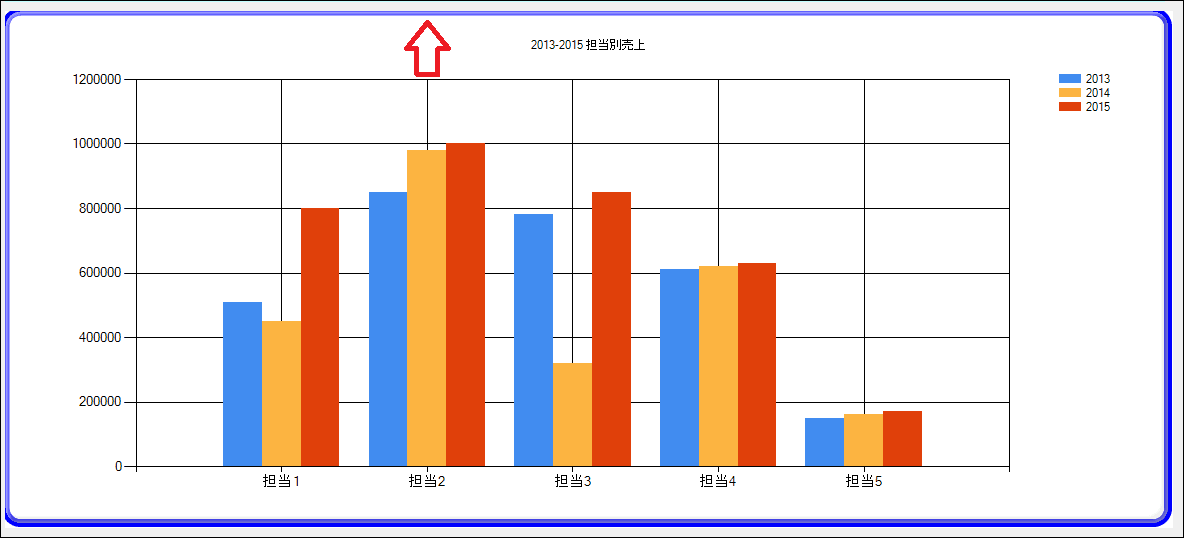
わかりにくいですがBorderSkin.SkinStyleにBorderSkinStyle.Raisedを使用することにより、少し浮き出た外観になります。
お読みくださってありがとうございました。それでは。